COVID-19: SLO County earns a ‘C’ in cutting back on daily travel
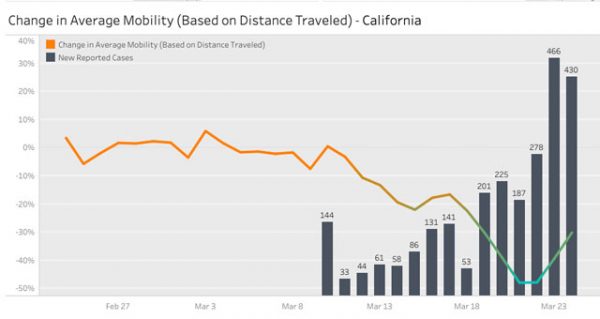
Smartphone data shows daily travel reduced by 28-percent in SLO County
–Even though San Luis Obispo County is under a shelter at home order and has at least 71 cases of COVID-19 coronavirus as of Sunday, data that tracks smartphone usage shows that the distance of local travel has only been reduced by 28-percent.
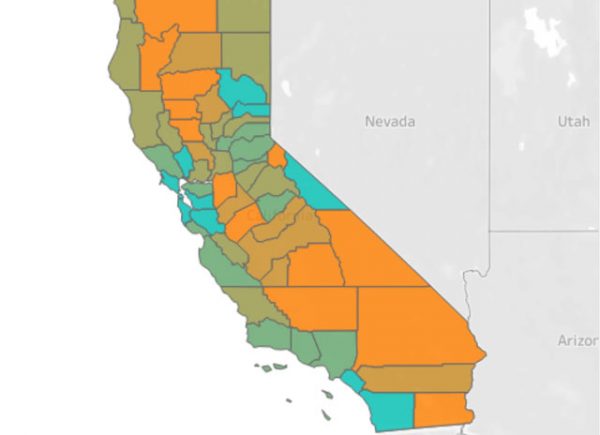
A New York Technology company Unacast, aggregated and mapped data from smartphone users to rate every county in the United States. San Luis Obispo County earned a ‘C’ compared to other counties in the nation. On average, other California counties received a ‘B’.
The nationwide data sampling was created by Unacast using five to 15-percent of all smartphone locations per county.
Caltrans does not have a system for measuring traffic flows in SLO County. “I do not have current traffic volumes for the highways in our district,” says Jim Shivers, a spokesman for Caltrans District 5. “The reports are published every three years or so. I am not aware of weekly or monthly comparisons: The last report was 2017,” he says. Some state data is available via Caltrans’ Quickmap App, which shows the flow of traffic in various parts of the state, but does not count vehicles. “Much of it is green right now and not orange or red,” Shivers says.
Unacast CEO Thomas Walle says, “While much is still unknown about COVID-19, it’s clear social distancing is widely agreed to be an effective way of slowing the spread, and a containment strategy advised by both the World Health Organization and the CDC. We have seen this work well in China, where the outbreak originated, and also in places like Singapore and South Korea.”
“It’s why we are applying our Real World Graph data engine to create a pro bono Covid-19 Toolkit to help public health experts, policymakers, academics, community leaders, and businesses in retail and real estate.” The first toolkit element, now live, is a new Social Distancing Scoreboard, which the company is making available to help raise awareness of and reinforce the importance of social distancing.
“We also believe it will not only help make sense of what’s happening now, but unearth trends that will help project scenarios in the short- and mid-term future,” he said.
Walle says in the mapping tool’s first iteration, the company explored:
- People dwelling at home vs dwelling outside their homes (a proxy for how good an area is at “shelter-in-place” behavior)
- Changes in average time spent in and around home, aggregated over time (a proxy for how much time people spend at home versus other venues)
- Change in dispersion of activity clusters, or how many people no longer gathered in the same location at the same time (a proxy for change in number of encounters)
- Change in average distance traveled
- Hitting a Moving Target
- Speed and accuracy were the two most important requirements for the first iteration; we aimed to provide users with the most useful information possible in the quickest way possible.
How to increase social distancing
- Switching to a home office strongly reduces the daily travel distance.
- Avoiding non-essential trips to entertainment places or spare-time facilities strongly reduces the travel distance.
- Canceling travels and vacations will strongly reduce travel distance.

Smartphone data tracking trips in California.
- Follow all local COVID-19 coronavirus news updates
- San Luis Obispo County COVID-19 website – readyslo.org
Comments
The news staff of the Paso Robles Daily News wrote or edited this story from local contributors and press releases. The news staff can be reached at info@pasoroblesdailynews.com.


