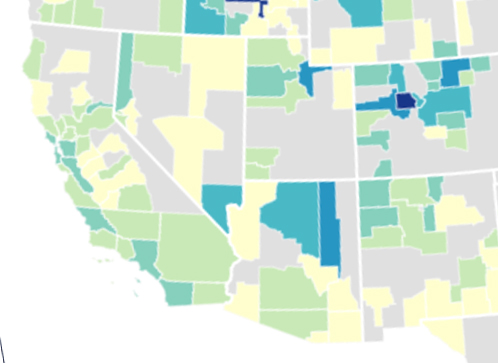
Data and map show rate of COVID-19 infection higher in SLO County than most of state

County by county analysis of the rate of infection per 100,000 population by New York Times.
–With a population of 283,405 and 89 reported cases of the COVID-19 coronavirus disease reported on Thursday, San Luis Obispo County‘s ratio of cases per 100,000 people currently stands at 31.6. That places SLO County in the top 10 counties out of 58 in the state, and more than double the ratio of most of its surrounding counties. The statewide ratio is 28.1 cases per 100,000 people as of Thursday.
Top 10 California counties, cases per 100,000
- Mono, 13 cases, ratio of 91.7
- Alpine, 1 case, ratio of 87.3
- San Mateo, 388 cases, ratio of 59.1
- San Francisco, 437 cases, ratio of 51.7
- Inyo, 9 cases, ratio of 49.8
- Santa Clara, 956 cases, ratio of 49.7
- Marin, 108 cases, ratio of 46.4
- San Benito, 23 cases, ratio of 38.7
- Los Angeles, 3,518 cases, ratio of 40.1
- San Luis Obispo, 83 cases, ratio of 31.6
Counties adjacent to SLO County, cases per 100,000
- Monterey, 48 cases, ratio of 11.1
- San Benito, 23 cases, ratio of 38.7
- Fresno, cases – 93 cases, ratio of 9.5
- Kings, cases – 4 cases, ratio of 2.7
- Kern, cases – 142 cases, ratio of 16.1
- Santa Barbara, cases – 111 cases
See details of coronavirus cases in California at New York Times.
Recent SLO County COVID-19 coronavirus updates
- SLO County reports 89 cases, including 15 health care workers
- IRS says no action needed by most people to receive coronavirus stimulus funds
- COVID-19 update from SLO County Superintendent of Schools
- Heritage Ranch reports case of COVID-19
- County asks pet owners to prepare care plans
- SLO County earns a ‘C’ in cutting back on daily travel
- Staff of Paso Robles Schools delivers uplifting message: ‘We’re all in this together’
- Operations limited at SLO County Courts
- Chamber of Commerce issues business update on COVID-19
- Closures to piers, beach parking lots, campgrounds, and parks.
- Plans to create a field hospital by April 8 at Cal Poly with 400-700 beds
- Call for volunteers to dramatically increase the county’s Medical Reserve Corps
- Follow all local COVID-19 coronavirus news updates
- San Luis Obispo County COVID-19 website – readyslo.org


